News & press releases
The (online) integration and testing of use-case big data analytics methods
We are all experiencing a challenging time during the Covid-19 pandemic and trying to find our ways of understanding and adapting to the situation. The CLASS team is facing this during the last period of the project, while trying to showcase the interesting technology we are developing in a real smart city use case in the city of Modena, Italy.
As part of the final phase of the project, we planned an exciting meeting in Modena to start testing the different use-case scenarios onsite, with real connected vehicles, and smart cameras at the streets. For obvious reasons, the onsite testing is not possible for now, but we keep working, highly motivated by the interesting data analytics methods we aim to demonstrate. For this, we rely on videos provided by the city of Modena (previously anonymised) that allow us to test the integration of the different technologies and analytics on a small scale computing infrastructure created in our own houses, reproducing those available in the city of Modena. And of course we rely on online meetings!

Big data analytics methods
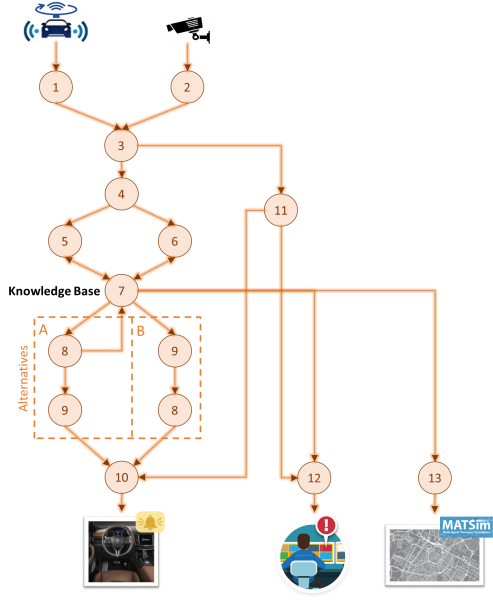
One of the last activities of the project is the final integration of all the data analytics methods that will be distributed across the compute continuum. The figure below shows the CLASS workflow that includes all the data analytics methods implemented within the scope of the CLASS project. The nodes represent the actual methods, and the edges represent the data dependencies existing among them.

In the figure, each number in a node corresponds to a different data-analytics method described below:
- Sensor fusion: Object identification based on the raw data from vehicles sensors. It takes data from LIDAR, GPS and cameras, processes it, and fuses the information gathered to obtain a single and more precise output per object. We distinguish between vehicles, e.g., car or truck, and vulnerable road users (VRUs), e.g., pedestrian or cyclist.
- Object detection: Object identification based on raw data from the city smart cameras. Similarly, we identify vehicles and VRUs.
- Object tracking: Computation of object identification (ID) for the initial detections, and tracking of each object as they move around frames in the video. Also, position, direction, and speed of objects are computed.
- Data deduplication: Elimination of duplicate objects, when identified in different videos with partial overlapping of the same area.
- Trajectory prediction: Prediction of the trajectory of objects, based on last positions, directions and speeds computed.
- Pollution computation: Estimation of emissions based on a composition of vehicle classes in the area of study, and the real-time data obtained, mainly speed and acceleration of vehicles over time.
- Data aggregation: Generation of a real-time knowledge base (KB) of the city events, based on information from different analytics and video sources.
- Collision prediction: Prediction of possible collisions amongst the objects detected, possibly in different video sources, and based on its trajectory prediction. There are two alternatives: predictions are made for (A) all the information available in the KB, (B) only to compute the warning area (WA) of a vehicle.
- Generation of warning area (WA): Computation of the WA for each connected vehicle, with data coming not only from its own sensors but also from the city smart cameras. It allows to compute and predict the existence of possible hazards beyond the vehicle’s field of view.
- WA alert visualization: If a hazard (collision) has been detected within a vehicle´s WA, an alert is shown to the driver.
- Parking counters: Computation of the available parking slots based on object recognition from the city smart cameras (counting down/up available slots, based on vehicles entering/exiting the parking area).
- Dashboard visualization: KB visualization for the city control room.
- Predictive models: Simulation of the dynamic adjustment of the digital traffic signs to adjust the traffic conditions, based on the real-time information collected.
We keep working from home to have everything ready for the better times that we are sure will arrive. By then, the CLASS team will be ready to celebrate and demonstrate the successful results of the project in the beautiful city of Modena!
